Lakeview documentation
Contents
Lakeview documentation#
Lakeview is a Python 3 library for creating publication-quality IGV-style genomic visualizations. Lakeview is based on Matplotlib.
A quick example:
# Import Lakeview
import lakeview as lv

# Load aligned segments in a selected region from a BAM file
painter = lv.SequenceAlignment.from_file(
    "PacBio_HiFi.bam", region="chr14:105,660,000-105,780,000"
)
# Create an empty GenomeViewer with two tracks
gv = lv.GenomeViewer(tracks=2, figsize=(8, 5), height_ratios=(1, 4))
# Plot alignment pileup
painter.draw_pileup(
    gv.axes[0],             # Plot on the first track of the GenomeViewer
    show_mismatches=False,  # Do not highlight mismatched bases
)
# Plot aligned segments
painter.draw_alignment(
    gv.axes[1],             # Plot on the second track of the GenomeViewer
    show_mismatches=False,  # Do not highlight mismatched bases
    sort_by="length",       # Plot longer reads first
    link_by="name",         # Link primary and supplementary alignments of the same read
    max_rows=30,            # Only show the first 30 alignment rows
)
# Adjust x axis limits
gv.set_xlim(105_670_000, 105_777_000)
# Save the plot
gv.savefig("example.png")
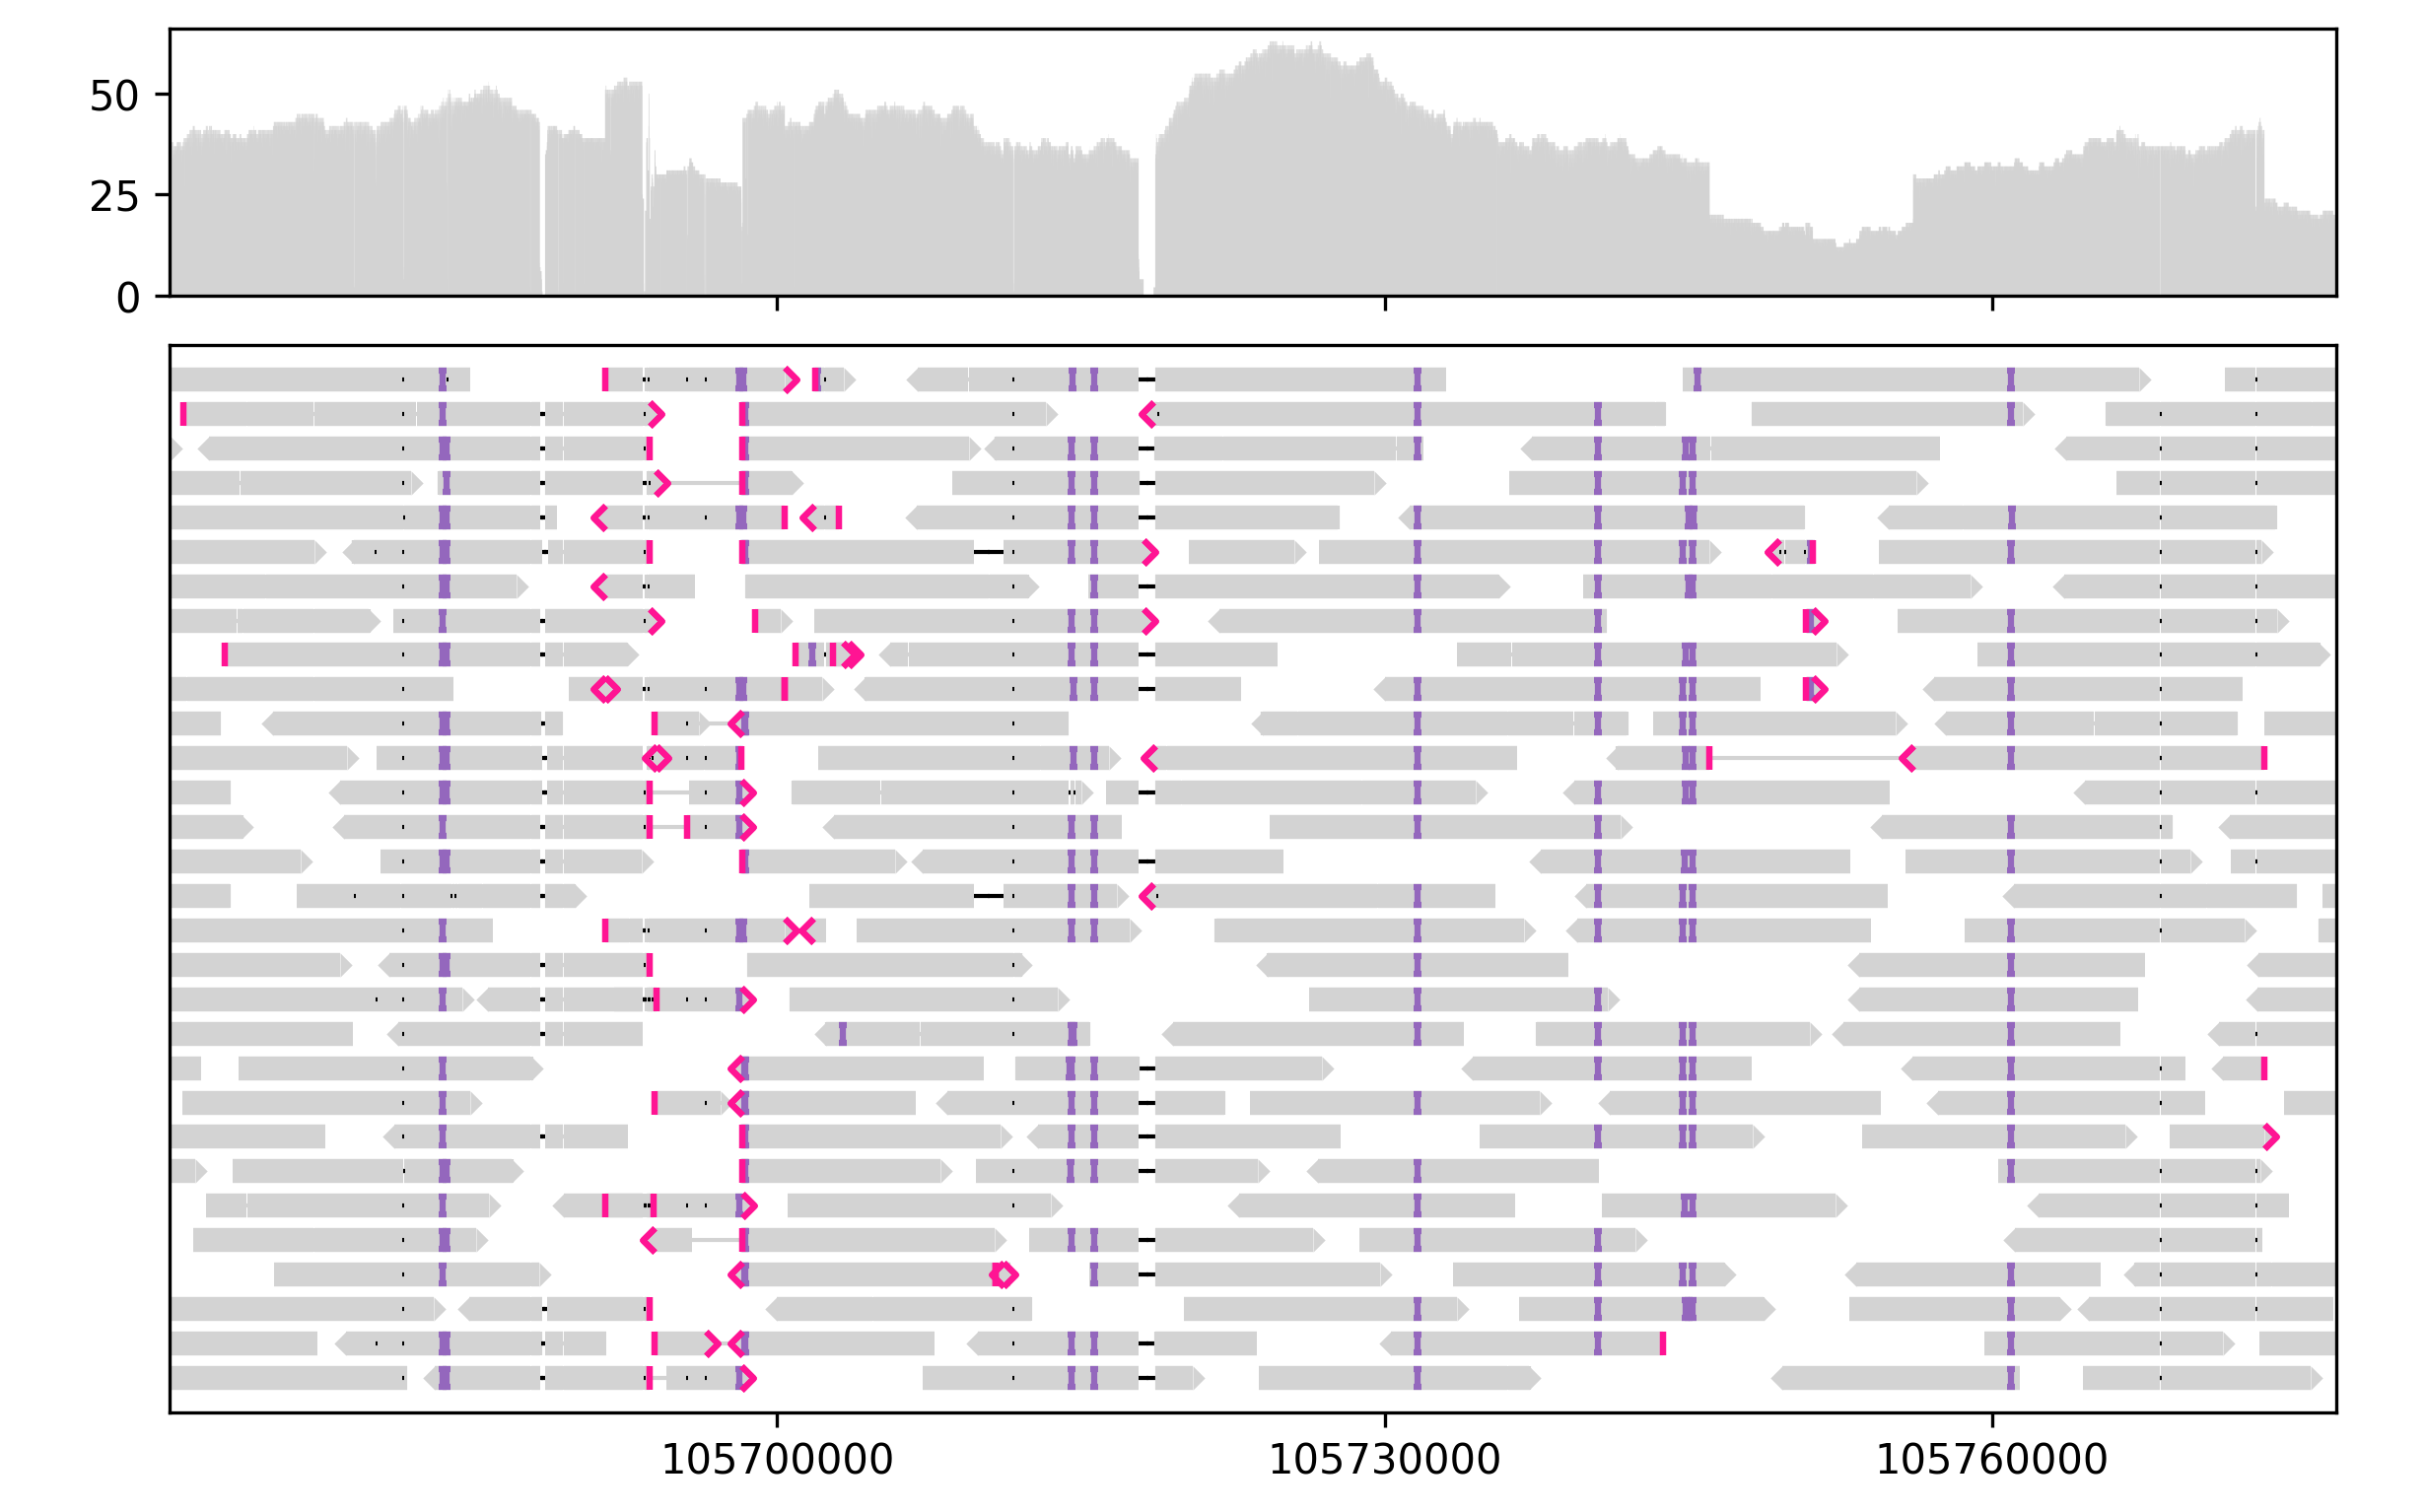
Lakeview currently supports visualzing sequence alignment, pileup, and gene annotation tracks. Additional functionality will be added in the future.
Features#
Improved clarity. Lakeview inherits the familiar and intuitive visual style of IGV, with a clear layout designed for publication and presentation.
Programmable plotting. Multiple files and genomic regions can be visualized automatically through a Pythonic interface inspired by Seaborn and Pandas.
Support for remote data. Genomic data are often stored in remote servers without display devices. With Lakeview, you can plot remotely and view the output figures locally. Lakeview works well with JupyterLab to streamline this workflow.
Transparency and reproducibility. Figures are plotted transparently and annotated explicitly. The input data and the plotting code contain all the information needed to reproduce the figure.
Customizable layouts. Lakeview supports many layouts implemented in IGV, while allowing the user to define custom rules for ordering, grouping, and coloring each segment. Advanced customization is possible via the Matplotlib API.
Interactive plotting. Lakeview ships with an interactive Jupyter Widget to help users locate their regions of interest.
Contents: