Translocation in the SKBR3 cell line
Translocation in the SKBR3 cell line#
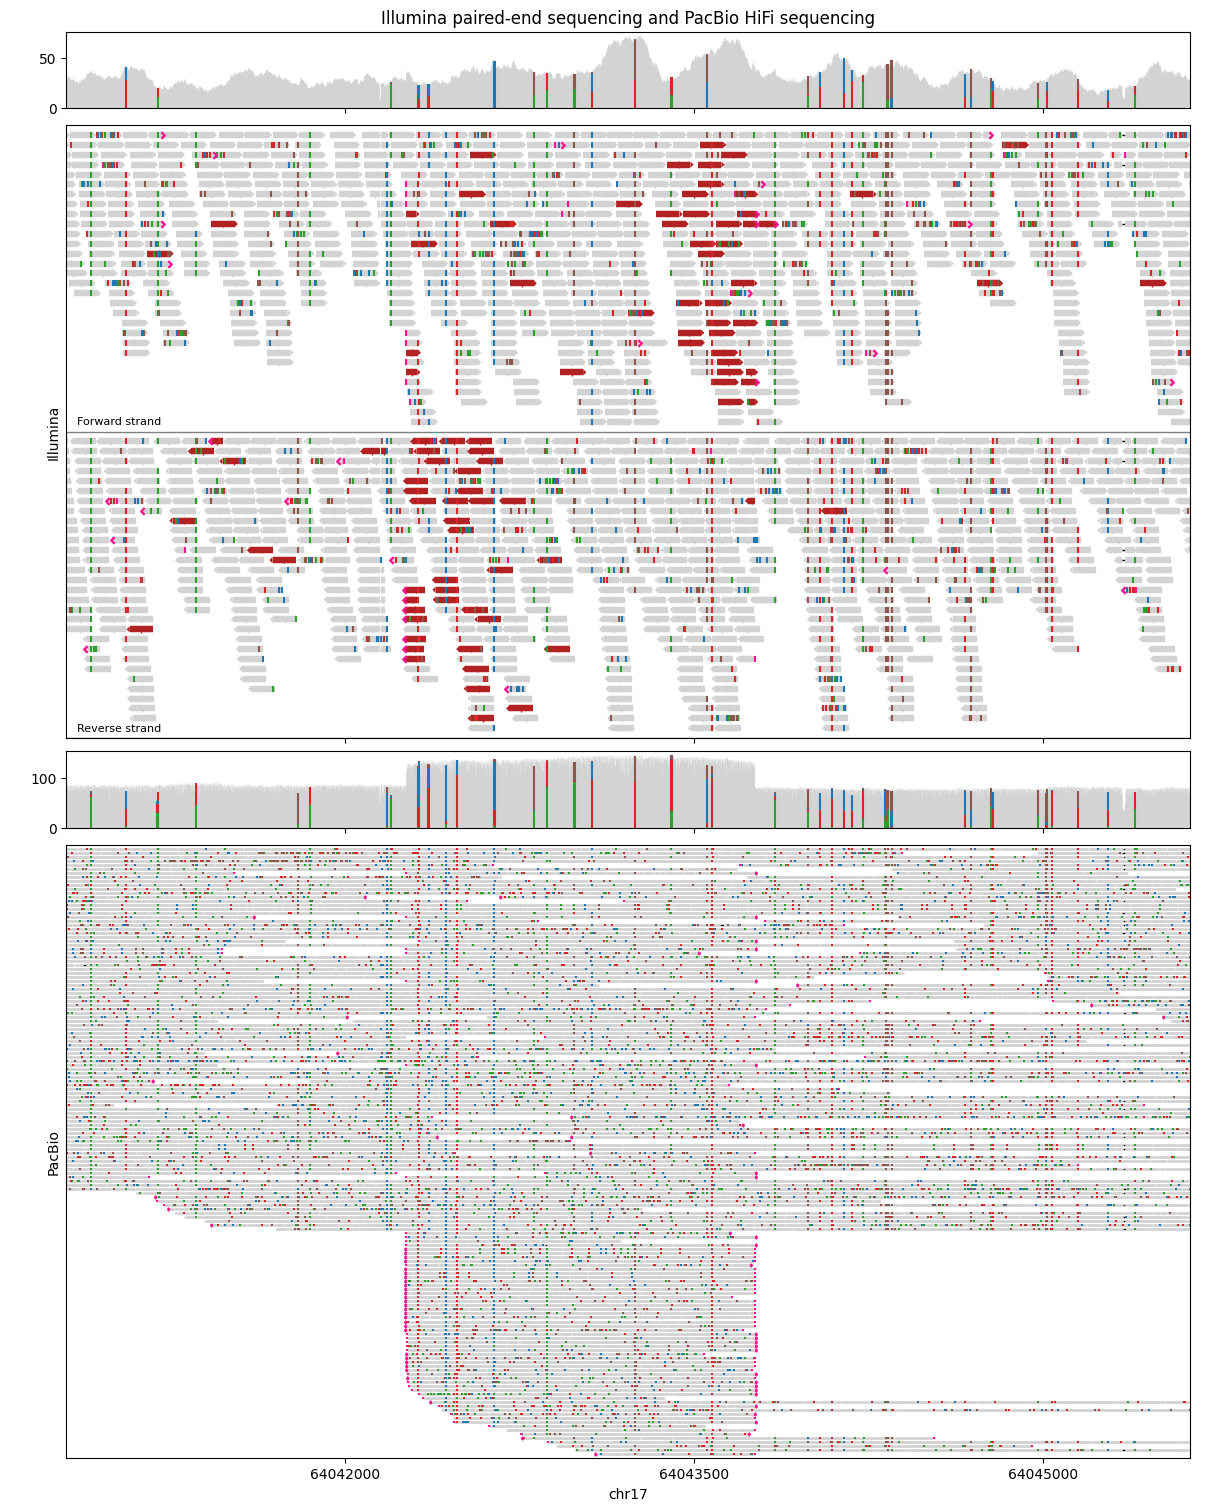
Here we visualize Illumina paired-end sequencing reads alongside PacBio HiFi sequencing reads, showing a translocation event. Both sequencing datasets were genearated from the SKBR3 breast cancer cell line. This example is also used by IGV Web.
Data sources:
Reference:
Nattestad, M., Goodwin, S., Ng, K., Baslan, T., Sedlazeck, F. J., Rescheneder, P., … & Schatz, M. C. (2018). Complex rearrangements and oncogene amplifications revealed by long-read DNA and RNA sequencing of a breast cancer cell line. Genome research, 28(8), 1126-1135.
import matplotlib.pyplot as plt
import lakeview as lv
CHROMOSOME = "17"
ILLUMINA_BAM_PATH = "../../tests/data/SKBR3_Illumina_550bp_pcrFREE.bam"
PACBIO_BAM_PATH = "../../tests/data/SKBR3_PacBio.bam"

illumina_painter = lv.SequenceAlignment.from_file(
    ILLUMINA_BAM_PATH, region=CHROMOSOME
)
pacbio_painter = lv.SequenceAlignment.from_file(PACBIO_BAM_PATH, region=CHROMOSOME)

gv = lv.GenomeViewer(4, figsize=(12, 15), height_ratios=(1, 8, 1, 8))
illumina_painter.draw_pileup(gv.axes[0])
illumina_painter.draw_alignment(
    gv.axes[1],
    color_by="proper_pair",
    group_by="strand",
    max_rows=30,
)
pacbio_painter.draw_pileup(gv.axes[2])
pacbio_painter.draw_alignment(gv.axes[3])

gv.set_xlim(64040802, 64045633)
gv.axes[1].set_ylabel("Illumina")
gv.axes[3].set_ylabel("PacBio")
gv.set_xlabel("chr17")
gv.set_title("Illumina paired-end sequencing and PacBio HiFi sequencing")
Show code cell output

gv.figure
