Customising alignment layout
Contents
Customising alignment layout#
Lakeview is built upon Matplotlib and inherits its incredible capacity for customizations. This tutorial demonstrates various ways to customise the output plot based on the same input data, which is typically achieved by passing optional arguments to the plotting function (such as lakeview.SequenceAlignment.draw_alignment).
The default#
Here we show the default output of Lakeview to be contrasted with specific customizations.
import lakeview as lv

# Load aligned segments in a selected region from a BAM file
painter = lv.SequenceAlignment.from_file(
    "../../tests/data/HG002_IGH_PacBio_CCS.bam", region="chr14:105,660,000-105,780,000"
)
# Create an empty GenomeViewer with one track
gv = lv.GenomeViewer(tracks=1, figsize=(8, 5))
# Plot aligned segments
painter.draw_alignment(gv.axes[0])
gv.set_xlim(105_670_000, 105_777_000)
Show code cell output
(105670000.0, 105777000.0)
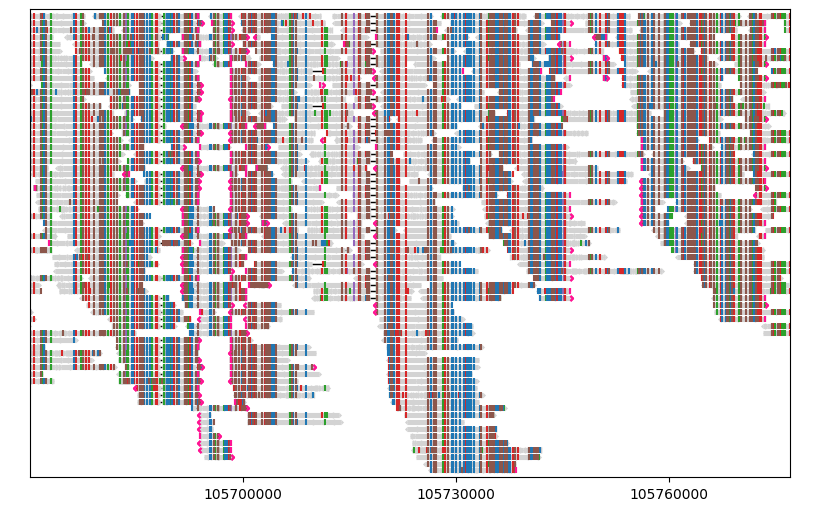
gv.figure

Showing/hiding specific visual elements#
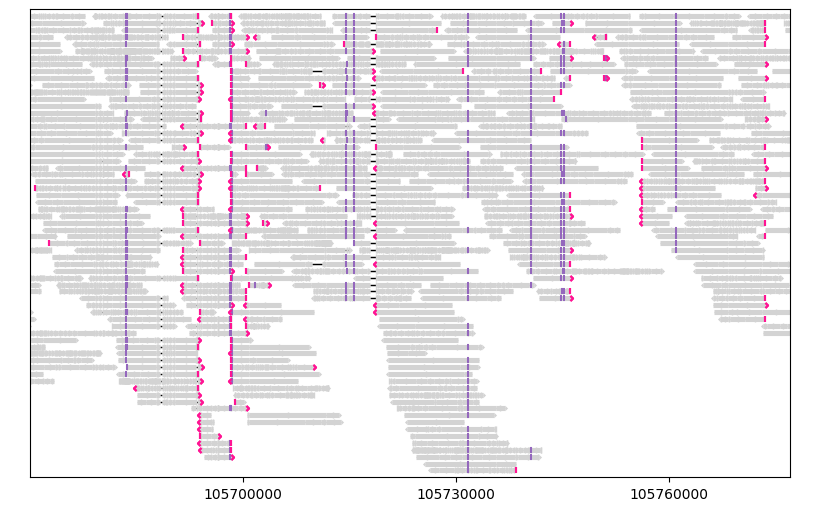
Most visual elements can be toggled on/off using the corresponding parameter starting with “show”. For example, if you would like to hide mismatched bases, specify show_mismatches=False.
gv = lv.GenomeViewer(tracks=1, figsize=(8, 5))
painter.draw_alignment(gv.axes[0], show_mismatches=False)
gv.set_xlim(105_670_000, 105_777_000)
gv.figure
Matplotlib keyword arguments#
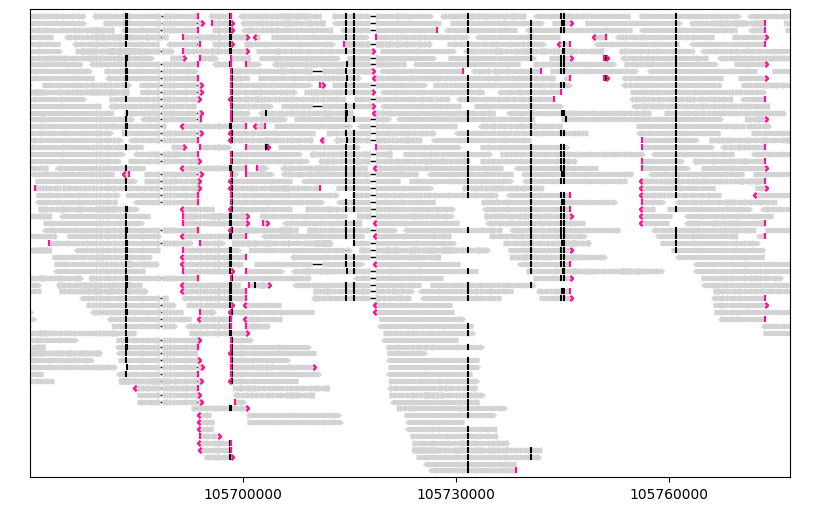
Almost all visual elements drawn by Lakeview can be customised by the corresponding keyword arguments, which will be passed to relevant Matplotlib functions. For example, if you want to show insertion markers in black rather than the default colour purple, you may do that by passing color="black" to insertions_kw:
gv = lv.GenomeViewer(tracks=1, figsize=(8, 5))
painter.draw_alignment(gv.axes[0], show_mismatches=False, insertions_kw=dict(color='black'))
gv.set_xlim(105_670_000, 105_777_000)
gv.figure
To find out which keyword parameters are supported for a given element, such as color, linewidth and fontsize, you may need to inspect the source code.
Data-dependent customization#
Often it is desired to arrange the visualization in a way that is not purely cosmetic, but informs certain aspects of the data. For example, a user may wish to link the primary and supplementary alignments of the same query sequence, group sequences by haplotype-specific markers, or highlight pair-end reads with unusual orientations. In Lakeview, this is supported by the use of five parameters, filter_by, sort_by, link_by, group_by, color_by, each offering an entrance point for data-dependent layout.
In general, each of the five parameters supports three types of values:
A
stringliteral representing a supported preset. For example,sort_by="lengthsorts all segments by their length (longest first) before plotting.An
Iterableof n values, where n is the number of aligned segments loaded. For example, if you specifysort_by=random_numbers, whererandom_numbersis alistof precalculated random numbers of length n, then the aligned segments will be shuffled randomly before plotting.A
Callablethat accepts anAlignedSegmentas the only argument, and returns a value to be used in filtering, sorting, etc. For example, if you specifygroup_by=lambda segment: 0 if segment.is_forward else 1, then segments mapped to the forward and reverse strands will be groupped separately before plotting.
filter_by#
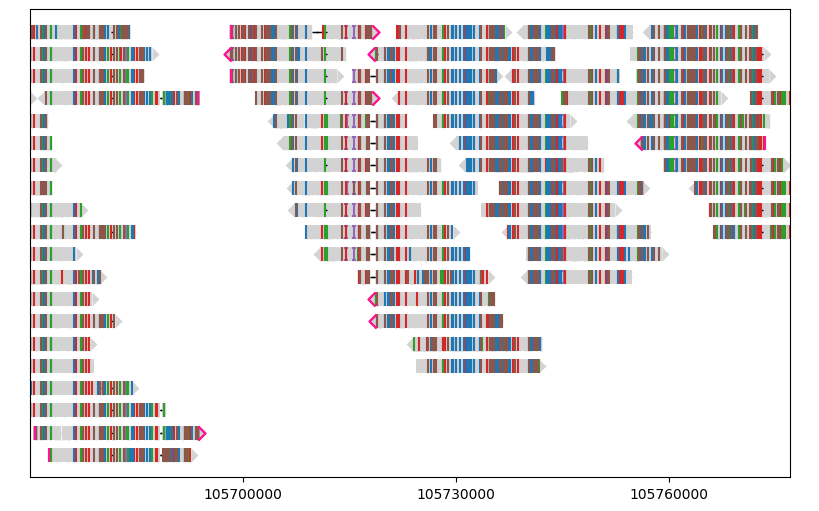
filter_by allows you visualize only a subset of segments present in the input BAM base on a custom rule. filter_by accepts a bool value for each segment and only include the segment if the value is True.
For example, let’s remove segments shorter than 15 kb:
gv = lv.GenomeViewer(tracks=1, figsize=(8, 5))
painter.draw_alignment(gv.axes[0], filter_by=lambda segment: segment.query_alignment_length >= 15e3)
gv.set_xlim(105_670_000, 105_777_000)
gv.figure
sort_by#
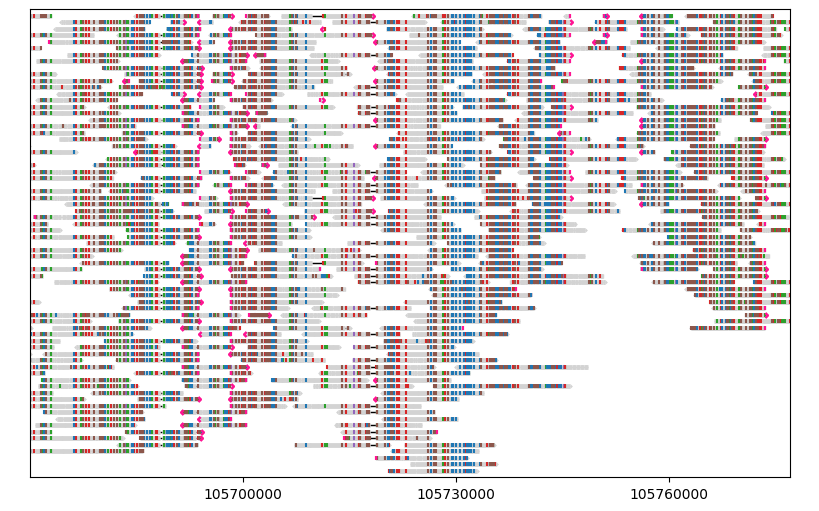
sort_by accepts a value (most commonly int, float and str) and sort segments based on the corresponding value before plotting.
For example, let’s randomly shuffle the segments:
from numpy.random import default_rng

random_number_generator = default_rng(3920)
random_numbers = [random_number_generator.random() for segment in painter.segments]
random_numbers[:10]
[0.11174910030200058,
 0.38261365584428964,
 0.5984047554571691,
 0.13897640824517798,
 0.260850256514894,
 0.04927694480060274,
 0.7115838426728361,
 0.8585827789629534,
 0.6863772495557511,
 0.21118263555829586]
gv = lv.GenomeViewer(tracks=1, figsize=(8, 5))

painter.draw_alignment(gv.axes[0], sort_by=random_numbers)
gv.set_xlim(105_670_000, 105_777_000)
gv.figure
link_by#
link_by links two or more segments together, drawing them on the same row connected by a horizontal line. link_by accepts a “link identifier” (most commonly int and str) for each segment, and links together segments with the same link identifier.
For example, let’s link together the primary and supplementary alignments of each query sequence, which is equalvalent to linking by the name of the query sequence:
gv = lv.GenomeViewer(tracks=1, figsize=(8, 5))

painter.draw_alignment(gv.axes[0], link_by=lambda segment: segment.query_name, show_mismatches=False)
gv.set_xlim(105_670_000, 105_777_000)
gv.figure
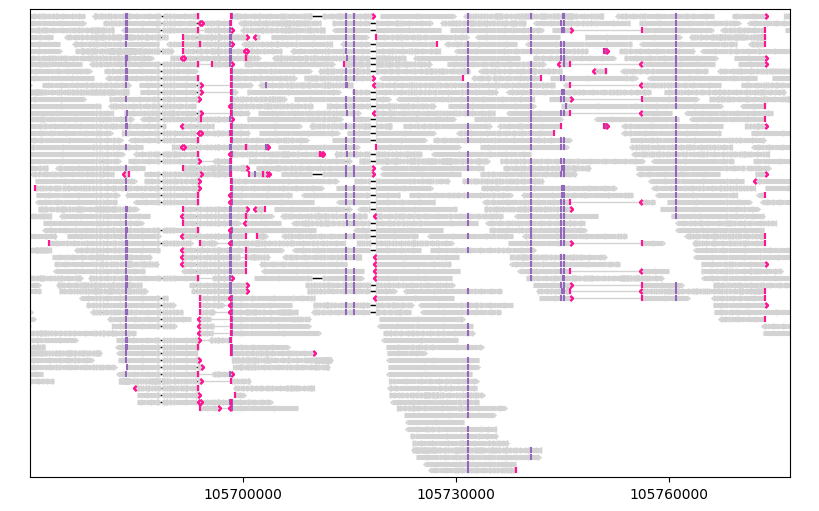
Note the linked segments at around 105.695 Mb and 105.750 Mb.
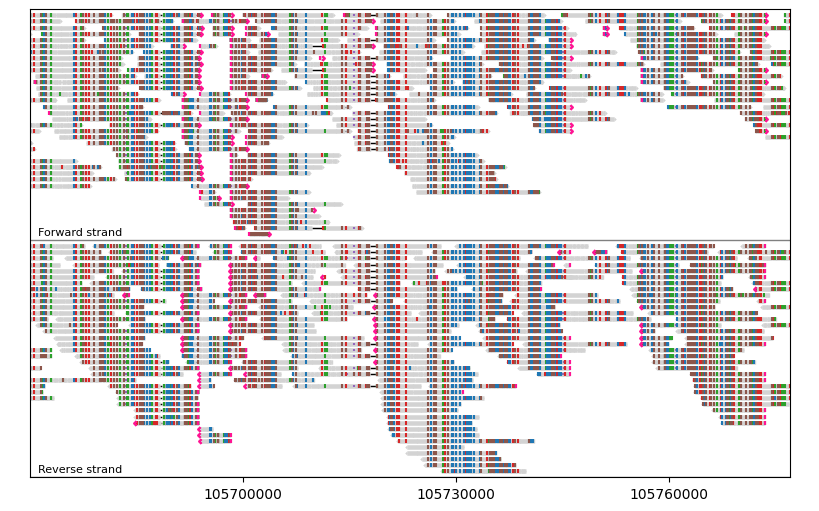
group_by#
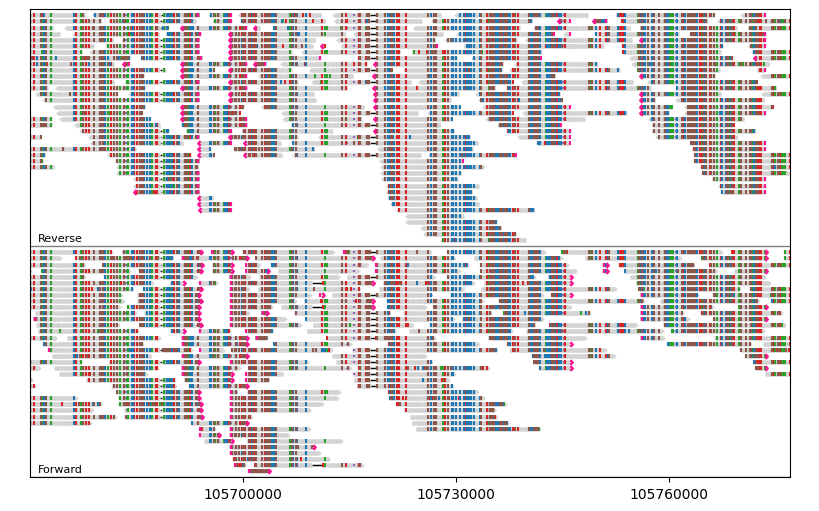
group_by catgorizes segments into separate groups with optional group labels. group_by accepts a “group identifier” (most commonly int and str) for each segment, and assigns segments with the same group identifier into the same group.
For example, let’s group segments by their orientations:
gv = lv.GenomeViewer(tracks=1, figsize=(8, 5))

painter.draw_alignment(
    gv.axes[0],
    group_by=lambda segment: segment.is_forward,
    group_labels={True: "Forward", False: "Reverse"},
)
gv.set_xlim(105_670_000, 105_777_000)
gv.figure
Alternatively, you can use the preset group_by="strand":
gv = lv.GenomeViewer(tracks=1, figsize=(8, 5))

painter.draw_alignment(gv.axes[0], group_by="strand")
gv.set_xlim(105_670_000, 105_777_000)
gv.figure
color_by#
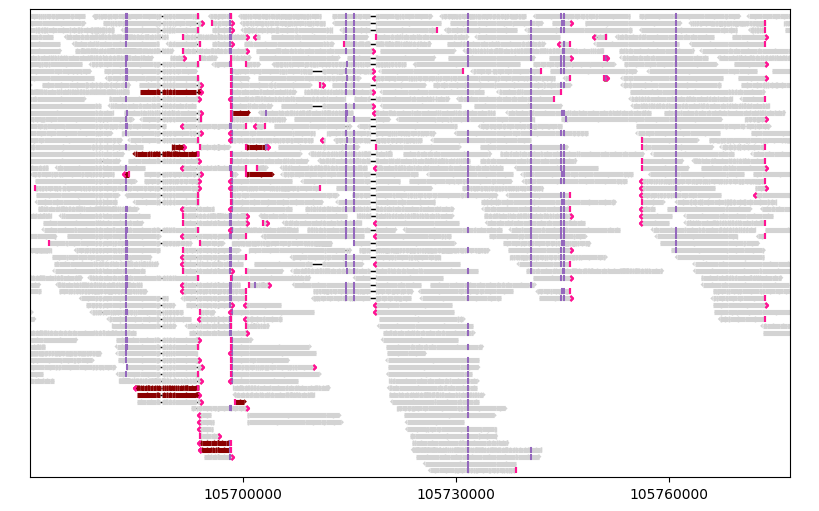
color_by allows segments to be colored individually. Each segment is mapped to a color, which defines the color of the segment backbone.
Let’s highlight segments with mapping quality less than 50 with dark red:
gv = lv.GenomeViewer(tracks=1, figsize=(8, 5))

painter.draw_alignment(
    gv.axes[0],
    color_by=lambda segment: "darkred"
    if segment.mapping_quality < 50
    else "lightgray",
    show_mismatches=False,
)
gv.set_xlim(105_670_000, 105_777_000)
gv.figure
