Interactive visualization
Interactive visualization#
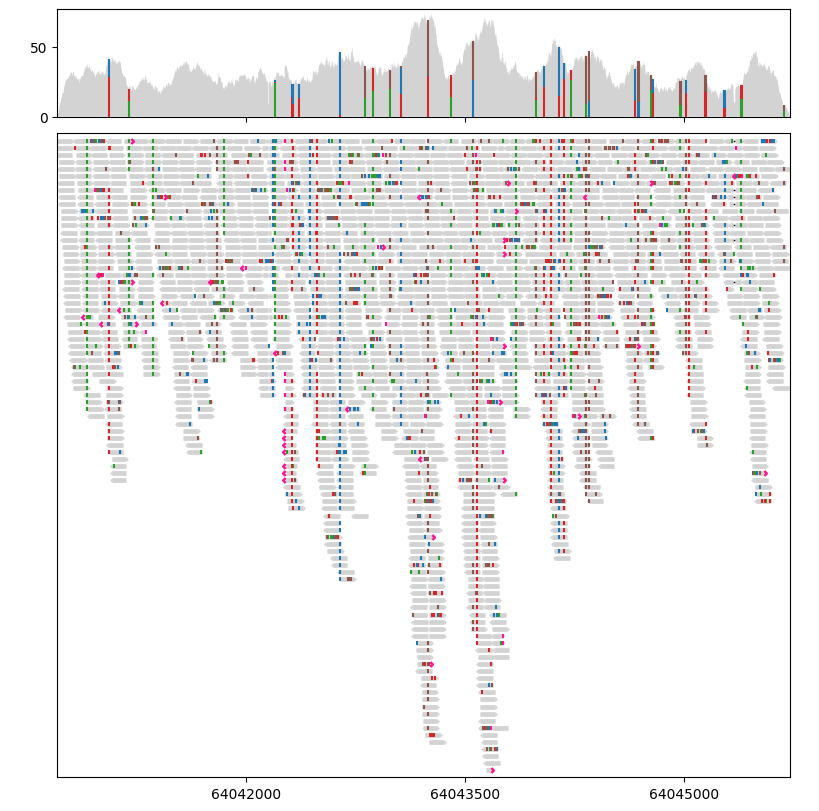
Lakeview provides basic support for interactive visualisation to help users navigate though the data and locate interesting regions. Interactive visualisation is designed for Jupyter Notebooks and implemented using Jupyter Widgets. Interactive visualisation requires a live IPython kernel. If you are viewing the static HTML version of this page, please use the button below to run this tutorial in Binder:
import lakeview as lv

BAM_PATH = "../../tests/data/SKBR3_Illumina_550bp_pcrFREE.bam"
REGION = "17:64,040,802-64,045,633"

# Load data from the BAM file
painter = lv.SequenceAlignment.from_file(BAM_PATH, region=REGION)
# Create a GenomeViewer with two tracks
gv = lv.GenomeViewer(tracks=2, height_ratios=(1, 6))

# Draw alignment pileup in the first track
painter.draw_pileup(gv.axes[0])

# Draw aligned segments in the second track
painter.draw_alignment(gv.axes[1])
Show code cell output

# Display the interactive widget
# Run this tutorial on Binder if you cannot see the widget
# https://mybinder.org/v2/gh/jzhang-dev/lakeview/HEAD?labpath=docs%2Ftutorials%2Fgenome_viewer.ipynb
gv.widget